MOHR Application Note:
TDR vs. FDR: Distance to FaultIntroduction
Distance-to-Fault (DTF) measurements, typically expressed in units of reflection coefficient, return loss, or VSWR as a function of distance, are used to find common faults in coaxial cables and connectors (Table 1). While 'Distance to Fault' conveys a simple, generic meaning applicable to measurements produced by any reflectometer, it is more commonly encountered when discussing Frequency-Domain Reflectometer (FDR) rather than Time-Domain Reflectometer (TDR) instruments, presumably because FDRs require additional signal processing capabilities including the inverse Fast Fourier Transform (FFT) of their native spectral data, in order to produce DTF information. In contrast, TDR waveforms intrinsically incorporate high-resolution DTF measurements.
Both TDR and FDR are useful microwave/RF measurement tools. Although hailed by some manufacturers as "new technology", FDRs are based on portable Vector Network Analyzer (VNA) technology, which has been around for several decades. FDR shares many of the same cumbersome calibration and usage requirements. Similar to VNAs, FDRs inject a swept narrowband signal source in the Device-Under-Test (DUT).
Table 1: Common Cable, Connector, and Antenna Abnormalities Detectable by TDR
Cable Problems — Coaxial and Twisted-Pair
Complete cable faults – open / short
Partial cable faults – minor shield, conductor damage
Thermal and UV insulation damage
Water ingress
Connector Problems
Corroded or loosened connectors
Low-quality connectors
Abnormal center pin alignment
Antenna problems
Variation from installed configuration
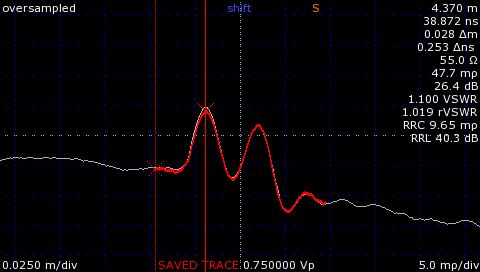
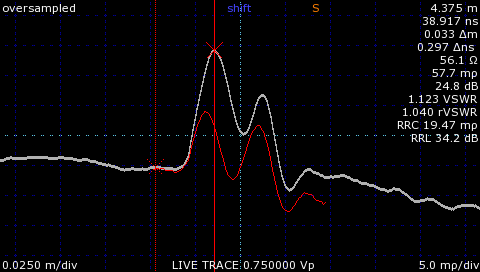
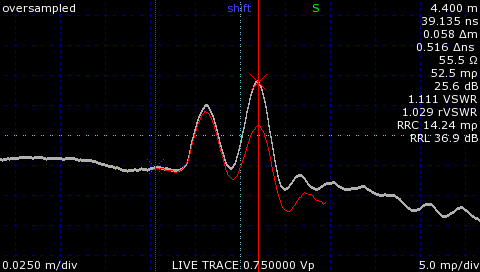
Figure 1: TDR waveform of a standard 50 Ohm Male-Male barrel connector (2.5 cm/div). The first screenshot shows both connectors properly tightened with an associated saved trace (red). Subsequent screenshots show the first connector incompletely tightened with a ~6 dB higher return loss than expected, then the second connector incompletely tightened with ~4 dB higher return loss than expected.
On the other hand, portable high-resolution TDRs are essentially precision oscilloscopes with paired broadband signal sources, producing a fast rising-edge "step" signal in high-performance instruments such as the Mohr CT100.
FDR measurements are built up over time by measuring reflected steady-state amplitude and phase over numerous discrete frequencies, while TDR measurements are instead built up by measuring reflected voltage at discrete moments in time. Not surprisingly, TDR and FDR are complementary and can produce many of the same measurements but are useful for different reasons.
In particular, because they measure reflection coefficient as a function of time (a direct surrogate for distance), TDRs have orders-of-magnitude better DTF precision than FDR, can more easily be used to measure cable and connector impedance including on non-50 Ohm and twisted-pair systems, and provide excellent fault sensitivity at the expense of modest frequency-domain performance.
FDRs understandably have excellent frequency-domain performance but demonstrate comparatively poor DTF capabilities, and suffer significant limitations when testing non-50 Ohm or twisted-pair systems.
TDR and RF/Microwave Measurements
Contrary to the claims of some FDR manufacturers, TDR instruments are indeed exquisitely sensitive to minor changes in microwave/RF performance. In fact, nearly all of the diagnostic information a TDR operator uses to detect and characterize cable and connector faults lies in the microwave/RF spectrum.
Although beyond the scope of this document, through the use of calibrated S-parameter estimation, TDRs from several manufacturers can be used to provide accurate frequency-specific return loss / VSWR and insertion loss measurements. This process is quicker with fewer calibration steps than when a VNA is used to make the same measurements, and dynamic range is adequate for many applications. Finally, while step TDRs are typically DC-coupled to the DUT, they are indeed capable of passing diagnostic microwave/RF frequencies through DC-blocking components to identify faults in a number of circumstances. An example of this is shown in a subsequent section. However, when performing troubleshooting and maintenance in the field, these sorts of measurements are time-consuming and usually unnecessary because a TDR trace usually highlights the problem component.
Coupled with their intrinsic high-resolution DTF measurements, TDRs' impedance sensitivity helps them identify extremely subtle changes in cable and connector performance. For instance, Figure 1 shows the TDR signature of a standard 18 GHz Male-Male SMA barrel adapter joining two 50 Ohm cables at 2.5 cm/div horizontal scale. The red trace has been saved with both connectors properly tightened. The next screenshot shows under-tightening of the first connector with ~6 dB higher return loss than normal, and the final screenshot shows under-tightening of the second connector with ~4 dB higher return loss than normal.
The saved trace in this instance not only highlights the presence of an under-tightened connector causing a few dB return loss, but which connector(s) are involved. Similarly, a corroded and/or substandard connector would stand out from a saved waveform from a "known-good" installation. These sorts of saved measurements are called up with a single button press and can save significant time when troubleshooting a wide variety of systems. The CT100 is capable of saving and recalling thousands of such waveforms.
TDR DTF Measurements
Localizing a known or suspected fault is often the most important task in field maintenance. As mentioned previously, TDRs measure DTF natively and measurements are therefore simple and quick. No prior calibration or other setup is necessary. TDR DTF resolution is limited only by the resolution of a given TDR's time-base or internal system clock, the system component allowing the instrument to freeze the propagation of the EM test signal in time. The CT100, for instance, features an internal timebase with 760 fs (7.6x10⁻¹³ s) resolution, equivalent to 0.003 in. (75 microns) in typical coaxial cable, regardless of the length of the cable. TDR range is somewhat arbitrary, as a longer range simply requires a longer duration between injection of the test signal and sample instant. At some point, practical range is limited by signal attenuation properties of the transmission line, but at least several thousand feet (several km) for most commonly-encountered types of twisted-pair and coaxial cable.
FDR DTF Measurements
Because they are the result of complex mathematical transformation rather than direct measurements, FDR DTF estimates are somewhat convoluted and require forethought in each situation. FDR instruments measure steady-state spectral content natively, and must use the inverse FFT calculation to produce DTF plots. Although testing a system at its operating frequency is described as a benefit by FDR manufacturers, FDR DTF resolution and range are determined by the following relationships, independent of system operating frequency:
where Vp is the velocity of propagation for the given cable (expressed as a fraction of the speed of light, c), ΔF is the bandwidth of the measurement, and N is the number of data points acquired.
These relationships highlight three important general considerations:
- FDRs must use the widest bandwidth possible to maximize spatial resolution
- FDRs must use the lowest bandwidth possible to maximize horizontal range
- Faults are unlikely to be effectively located by FDR at the operating frequency of most systems
To measure a 30 m. cable (Vp 0.7) at the highest resolution possible using a 10 GHz bandwidth FDR capable of acquiring up to N = 517 data points, one would first need to determine the maximum resolution for the given range, in this case the cable length, or N/Range(m) = 6 cm. This maximum resolution likewise determines the necessary bandwidth ΔF of the measurement, regardless of the system operating frequency or bandwidth capabilities of the instrument. In this case, ΔF = 1.5x108 * 0.7 / 0.06 m. = 1.8 GHz. In a 1,000 m. cable, the requisite resolution and bandwidth would be 50 cm. and 200 MHz, respectively, again regardless of the system operating frequency.
As with all FDR measurements, these measurements assume fresh calibration and might require up to 4 s per sweep for a typical instrument, introducing the potential for measurement error if a calibration step is forgotten and limiting an operator's ability to detect transient faults.
For the same systems, the CT100 would provide TDR waveforms with 0.008 cm. DTF resolution requiring 2 ms for the 30 m. cable and 40 ms for the 1,000 m. cable, fast enough to capture the fastest transient faults and allowing for real-time waveform smoothing and other forms of digital filtering. These waveforms would additionally include local impedance information, in which thermal, sunlight/UV, and water damage can be easily identified as segmental variations in cable impedance.
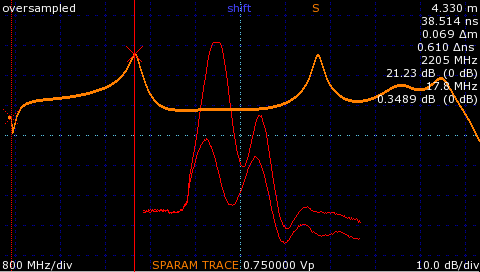
Figure 2: The same 50 Ohm SMA Male-Male coupler as in Fig. 1 now with ~7.5 dB excess relative return loss across the first connector. An FFT comparison trace produced from the two faults gives a quick rough estimate of what the dominant reflected frequencies are. Excess return loss at DC is near 0 dB, as expected, with a first peak near 2.2 GHz on the order of 20 dB. Another peak shows up near 5 GHz. However, it is visually obvious from the short wavelength (~5 cm.) of the associated TDR waveform that most of the energy in the 7.5 dB lumped return loss measurement will be centered in the low GHz range, making additional analysis unnecessary.
Broadband Nature of Cable Faults
Essentially all cable and connector faults are broadband and preferentially attenuate higher frequencies. Testing at system operating frequency, claimed to be a benefit by some FDR manufacturers, is unnecessary and would be both insensitive and inaccurate. Catching a fault before it significantly impairs system performance by definition requires testing outside of the normal system bandwidth.
Figure 2 demonstrates the broadband nature of the connector abnormality first shown in Figure 1. Visually, we know the saved TDR waveforms (red) in Figure 2 are broadband because of their discrete nature, and they show wavelengths on the order of 5 cm, so it is clear that the reflected frequencies will be centered in the low GHz range and further analysis is probably unlikely to be helpful. However, quick FFT analysis can be used to give a rough estimate of the actual dominant frequencies returned by the fault.
Either way, in a system that is operating out of specification, any component that demonstrates abnormal return loss / VSWR (whether frequency-specific or lumped-parameter), easily identifiable as variation from TDR or FDR DTF measurements taken at installation or inferred from manufactured specification, needs to be inspected and/or replaced.
Because TDRs such as the CT100 provide measurements that are orders-of-magnitude faster and more precise that FDR DTF measurements, TDRs usually provide the quickest and most robust cable and connector fault detection and localization in typical microwave/RF and digital systems.
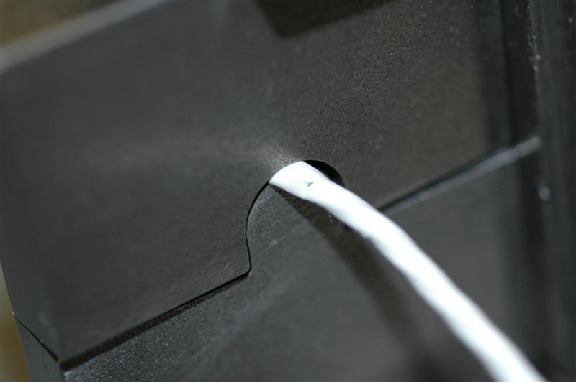
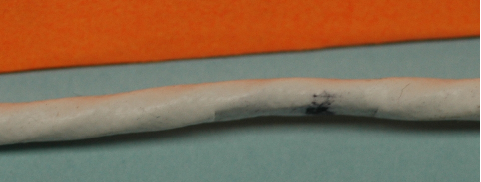
Figure 3: Non-destructive clamp fault, causing deformation of the shield and underlying twisted-pair but no significant permanent damage following its removal. There would likely be no significant impairment of system performance.
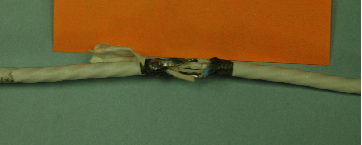
Figure 4: Partial shield fault. The shield remained electrically contiguous with no significant DC resistance. The underlying twisted pair is undamaged.
TDR and Passive RF Components
As mentioned previously, TDR instruments do indeed utilize microwave/RF frequencies for fault detection, localization, and characterization. The following example illustrates this fact in a twisted-pair digital system incorporating passive DC-blocking RF coupling transformers. While techniques such as FDR may be the best bet when testing through narrowband passive components is required, this example demonstrates that TDR may still be useful.
The MIL-STD-1553B databus is a shielded-twisted pair communications system encountered in a number of avionics platforms. Stub cables passing from various types of instrumentation pass digital serial data to the bus through DC-blocking isolation transformers known as couplers.
A test system involving focal non-destructive clamp compression of the stub shield as well as a destructive partial shield fault was constructed and a CT100HF TDR was used to identify, localize, and characterize these faults by testing through a coupling transformer. Figure 3 shows the non-destructive clamp and resultant minor marking on the cable jacket. Figure 4 shows the partial shield fault, which remained electrically contiguous.
Other than clamp compression, no damage to the underlying twisted pair cable was introduced, and there would likely have been insignificant degradation of system performance. However, in the context of an avionics platform, such damage could signal impending catastrophic failure were the damage to progress.
Figure 5 shows TDR measurement results using the CT Viewer™ TDR waveform analysis software package. The system is tested from the left of the screen. The transformer is near the left side of the screen at the location of the dotted (inactive) vertical cursor.
The two black traces are the TDR traces of the cable with the non-destructive clamp in place and then following its removal. The gray traces are the associated 1st derivative traces. The large baseline undulation at the left of the screen in these traces is due to the inductive effect of the transformer. The large bump toward the right of the screen on the gray traces is the partial shield fault shown in Figure 4. The red trace is a 1st derivative subtraction trace that removes the baseline variation caused by the transformer and shows the large and obvious transient effect of the clamp through the isolation transformer at the site of the solid (active) cursor. The red difference trace does not show the partial fault further down the cable (the large bump in the gray traces) because it is the same before and after the clamp was removed.
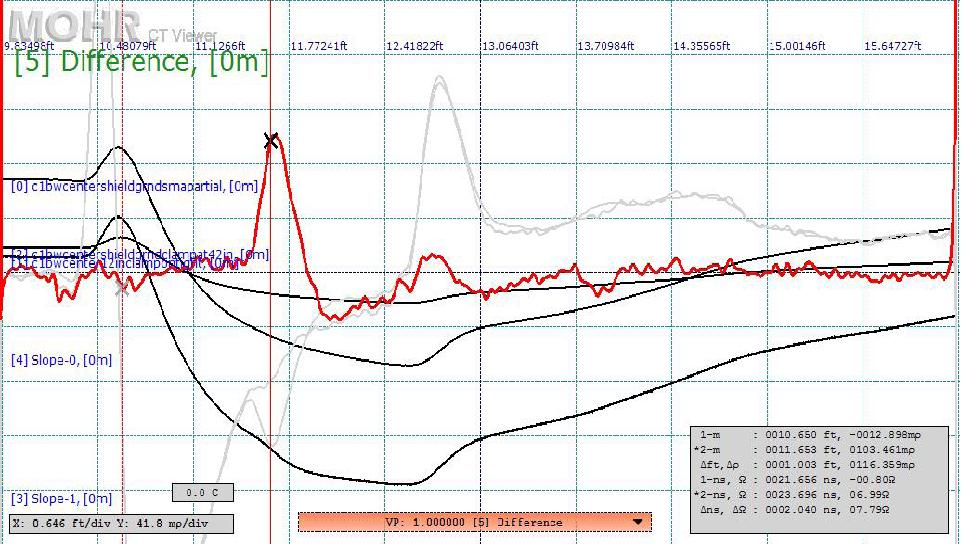
Figure 5: CT Viewer™ representation of the MIL-STD-1553B databus test setup. The system is tested left to right, with the isolation transformer near the left-hand side of the screen at the location of the dotted (inactive) vertical cursor. The black and gray traces are the raw TDR and 1st derivative traces with the clamp in place and following its removal, with undulation near the left side of the screen representing the inductive effect of the transformer. The fixed gray trace faults near the middle of the screen are due to the fixed partial shield fault. The red trace shows the effect of the shield clamp approximately 1 ft. after the transformer (black X). Notice that the coupling transformer essentially converts the step TDR into a pulse TDR.
This demonstration illustrates a few key points, in particular that TDR works well with twisted pair, and that TDR is clearly a broadband testing method that can work through DC-blocking passive RF devices when necessary to produce precise high-resolution distance-to-fault measurements, even with minor, reversible, non-destructive partial faults like clamp compression.
Conclusion
High-resolution TDR is a versatile, easy to use broadband testing method that provides precision Distance-to-Fault (DTF) measurements supplemented with useful frequency-domain information. When quick, accurate localization of cable and connector faults are needed in the field, TDR is usually a better choice than FDR. Comparison of TDR waveforms with "known-good" configuration easily highlights even minor cable and connector performance degradation. TDR should be considered even when testing through passive DC-blocking components such as transformers.